
The Wage Compression that Persisted

A few of years back, David Autor, Annie McGrew and I discovered something out of character for the modern U.S. labor market: during and after the pandemic, the wage distribution became more compressed … as in less unequal. Workers near the bottom saw unusually rapid pay increases, and measures like 50–10 and 90-10 inequality fell sharply. In that paper, and in an earlier post, I tried to put the episode in context and explain why, in a tight labor market, faster wage growth at the bottom isn’t a paradox; it’s what you expect when employers actually have to compete for workers.
Since then, the question I’ve heard most often is straightforward: did it last? Was the compression just a temporary aftershock of reopening, supply chain chaos, and inflation: something that would fade as the labor market cooled?
We now have enough data to give a more solid answer through November 2025. The headline is that most of the pandemic-era “unexpected compression” has persisted. But wage growth at the bottom during 2025 was not great.
The raw picture is in the first figure: the 10th, 50th, and 90th percentiles of hourly wages over time, each expressed relative to 2019. Before the pandemic, the pattern shows broad-based wage growth. Now, broad-based wage growth is nothing to scoff at: for most of the post-1980 period, wage growth had been far higher at the top. But the real break comes after 2020: wages at the bottom rose substantially more than at the middle and the top. By 2024 and into 2025, the 10th percentile has pulled distinctly ahead of the median and the 90th percentile in cumulative growth since 2019. That’s wage compression in its most direct form: not simply that wages are higher, but that the lower tail has moved up more than the top (or the middle).
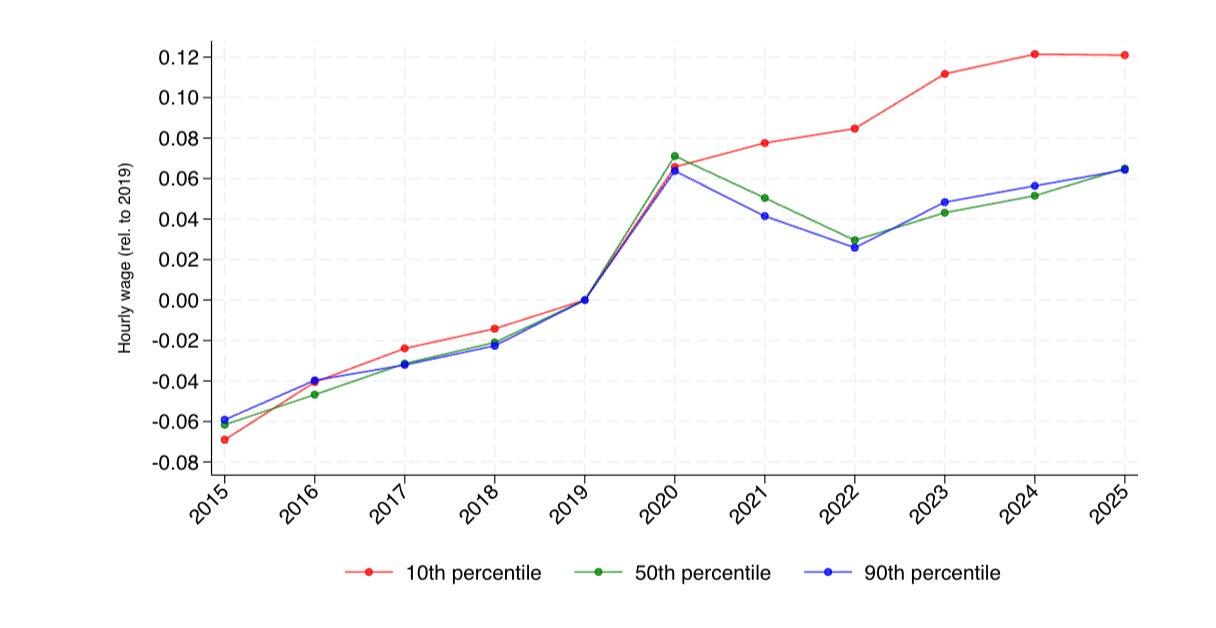
The key question is whether the relative gains at the bottom that occurred in 2021/22 were given back. It turns out that the answer is that they mostly weren’t. The bottom wage that rose sharply in 2021–2023 remains elevated relative to the middle and top through 2025. The sharp reduction in 50–10 and 90-10 inequality—driven by big increases at the bottom—has largely persisted. At the same time, the 10th percentile saw little growth in real wages over 2025, a worrying sign.
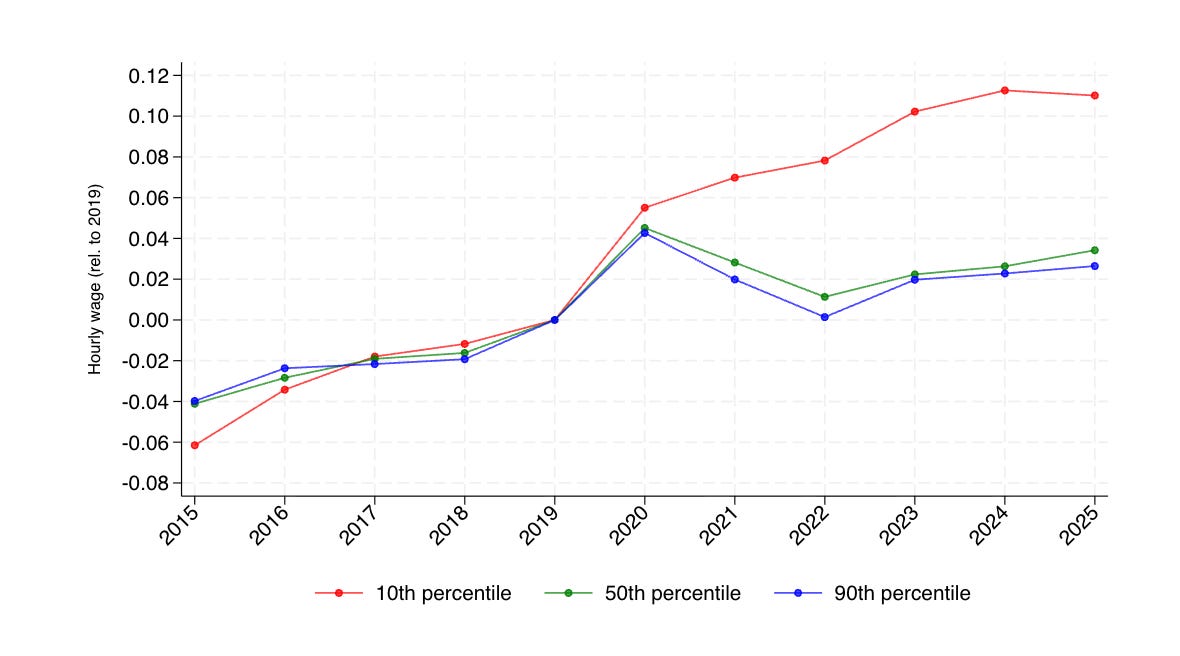
A natural objection is that some of this could reflect composition: who is working, and who is “low wage,” can change over time. If the workforce becomes more educated, older, or otherwise different, measured percentiles might shift even if underlying pay-setting doesn’t. That’s why the second figure is important. It adjusts wages for changes in demographic composition—age, education, and gender—so the percentiles better reflect shifts in the wage structure rather than shifts in the mix of workers.
Here the result is striking: the adjustment doesn’t weaken the compression story; it strengthens it. The bottom still shows strong cumulative gains, while the median and the top show more muted movement. That’s exactly what you’d expect if a core mechanism was intensified competition in low-wage labor markets—pressure that forces employers to raise pay in jobs that had previously been priced low because workers’ outside options were weak. (At the same time, real wage growth during 2025 at the bottom seems to have slowed down, whether adjusted for composition or not.)
It’s also worth briefly situating this against the Atlanta Fed Wage Growth Tracker, since it’s often used as a check on what’s happening “at the bottom.” The tracker (as shown in your third figure) looks at within-person wage growth by initial wage level. In broad strokes, it aligns with the persistence story for most of the distribution: wage growth for the second quartile looks similar to the third and fourth quartiles before the pandemic, is stronger in 2022–2023, and doesn’t obviously “snap back” afterward. The first quartile is more distinctive, showing unusually strong growth through 2023 and weaker growth more recently. However, this is also broadly consistent with the slowdown in real wage at the bottom in the cross sectional data.
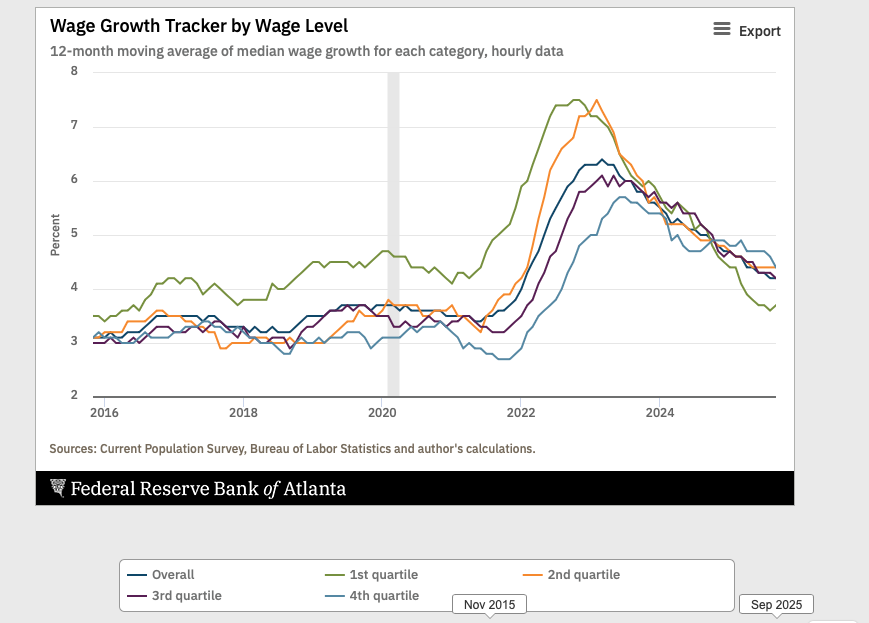
One point to note, though, is that the tracker is not designed to answer exactly the question the first two figures are answering. The cross-sectional percentiles are about levels: what is a low-wage worker making, and how has the wage distribution shifted? The tracker is about within-person changes: if someone is low wage today, what wage growth will they see over the next year? Following the same people is a real advantage because it sharply reduces composition concerns about who counts as “low wage” at any point in time. But it is, by construction, a different object than the cross-sectional wage distribution. That’s why the demographic adjustment in the second figure matters here: it’s a partial way to address composition while keeping the focus on changes in the wage distribution itself.
So where does that leave us? Through November 2025, the core fact is that the pandemic-era “unexpected compression” has largely persisted. Low-end wages rose much faster than the middle, and those relative gains haven’t been given back.
Will it last? That depends on how far the labor market softens. Compression reflects worker leverage and outside options; if unemployment rises and hiring slows materially, the lowest-wage gains are the most vulnerable. The slow-down in real wage growth at the bottom in 2025 is, unfortunately, not encouraging. It’s also worth remembering how unusual this kind of broad-based, compressive wage growth is in recent U.S. history—rare from 1980 to 2016, aside from a late‑1990s burst.
For the longer institutional story of why broad-based wage growth has been so rare—and what it would take to make it more normal—see my book, The Wage Standard.
Great post, especially the adjusted graph of changes in wages at various percentiles of the dist.! Although I am unfortunately now rather unsure how I was unaware that the Wage Growth Tracker exists...
Does the Atlanta Fed Wage Growth Tracker group by initial wage level or average over the initial and end wages for a person? I thought it was the average, based on their methodology documentation. Grouping on initial wage only would probably lead to very high growth at the bottom almost always (due to mean reversion).