Wage growth, inflation, and inequality
Using within-person wage comparisons to measure wage growth
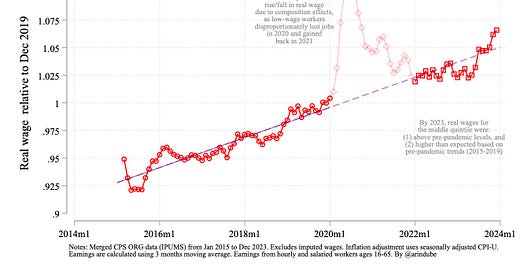
There has been considerable interest of late in better understanding how wages have grown relative to prices over the past several years. Using data from the household-based Current Population Survey through December 2023, the average wage for the middle quintile of workers (based on hourly earnings) stands higher than: 1) prior to December of 2019 (right before the pandemic), 2) December of 2020 (right before the start of the Biden presidency), and 3) what would be expected based on trends from the five years prior to the pandemic (2015-2019).
However, discerning exactly what happened to real wages specifically during the 2020-2021 period is challenging. This is because the mean (or median) wage over that period was heavily affected by changing composition of who was or was not working during the downturn and the subsequent recovery. This has led to efforts at analyzing wage growth within workers in an attempt to account for the "composition bias" that afflicts simple wage trends.
In this piece, I discuss some conceptual issues around using within-person wage comparisons to understand overall wage growth in the labor market, and provide some new findings to expand our understanding. To summarize, I find the median wage growth, or share of workers seeing wage fall in real wage, will tend to understate overall wage growth experienced by most workers when (1) much of the real wage growth has happened at the bottom of the pay scale, and (2) substantial portion of this wage growth has come from workers changing out of particularly poorly paying jobs to better paying ones. Focusing on earners whose initial wages placed them in the bottom 60 percent of earnings suggests that real wage growth was more tepid but clearly positive for most of these workers even during 2021 and 2022.
Conceptual issues
Tracking wages for the same person over time has some advantage over tracking the average or median wage over time, because the composition of workers is changing the latter case but not the former. However, there are also some limitations that are worth bearing in mind.
Comparing wages for an individual 12 months apart (as allowed by the Current Population Survey [CPS] data) can still fail to address a selection issue: who is working (and hence has a wage) in both periods. Most obviously, as unemployment fell over 2021 and 2022, more workers entered the labor market. The increase in the number of earners is important on its own right, and illustrates increasing well being that won't be captured by focus on the average wage. Additionally, however, if these workers tended to land better jobs than they used to have say in early 2020, this improves the (true) average job quality over time, but won't be captured in this analysis because in the CPS data we only observe each individual twice, 12 months apart. This is not just a theoretical possibility: given the evidence we've seen that work has been reallocated towards better jobs, it suggests the selectivity from re-entry is likely to be real, and will understate the true improvement in overall wages over the 2021-22 period.
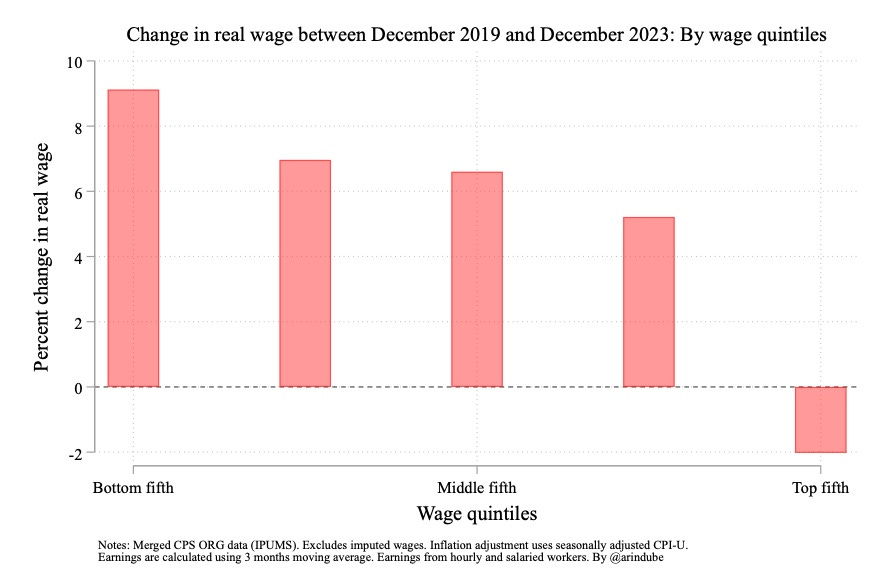
Second, it is important to look at wage growth at different parts of the (initial) wage distribution, since existing evidence (such as my work with David Autor and Annie McGrew) suggests that wage growth has been much stronger at the bottom. Updated evidence through end of 2023 shows a persistent compression in wages from changes over the past 4 years, where wages grew more strongly at the bottom and middle than at the top.
It’s good to keep in mind that the median wage change does not tell us how the wages were changing for the median worker. The former ranks individuals by wage changes, while the latter ranks them by the level of their initial wages. A key issue is whether the negative wage changes were more prevalent among higher wage earners. As we will see, they were.
Third, the median wage change is useful as it gives us a sense of the "typical" change experienced by workers. However, if lower wage workers are seeing much bigger gains in real wages than real wage losses among those at the top—say because of wage gains from job changes became larger for low-wage workers following the pandemic—the size of the changes matters as well if we want to better understand the overall change in wages. Additionally, it’s possible that major cost-of-living adjustments to wages were staggered for workers: maybe some people got a major bump in 2021 while others got one in 2022. In this case, the sum of the median annual increase would understate the median 2 year increase over the 2021-2022 period.
For these reasons, below I'll report not only the median but also the mean, and the trimmed mean which excludes the top and bottom 10 percent of changes. This trimmed mean tends to reduce the influence of outliers—similar to the median—but also pays attention to the size of wage changes.
Real wage changes along the wage distribution
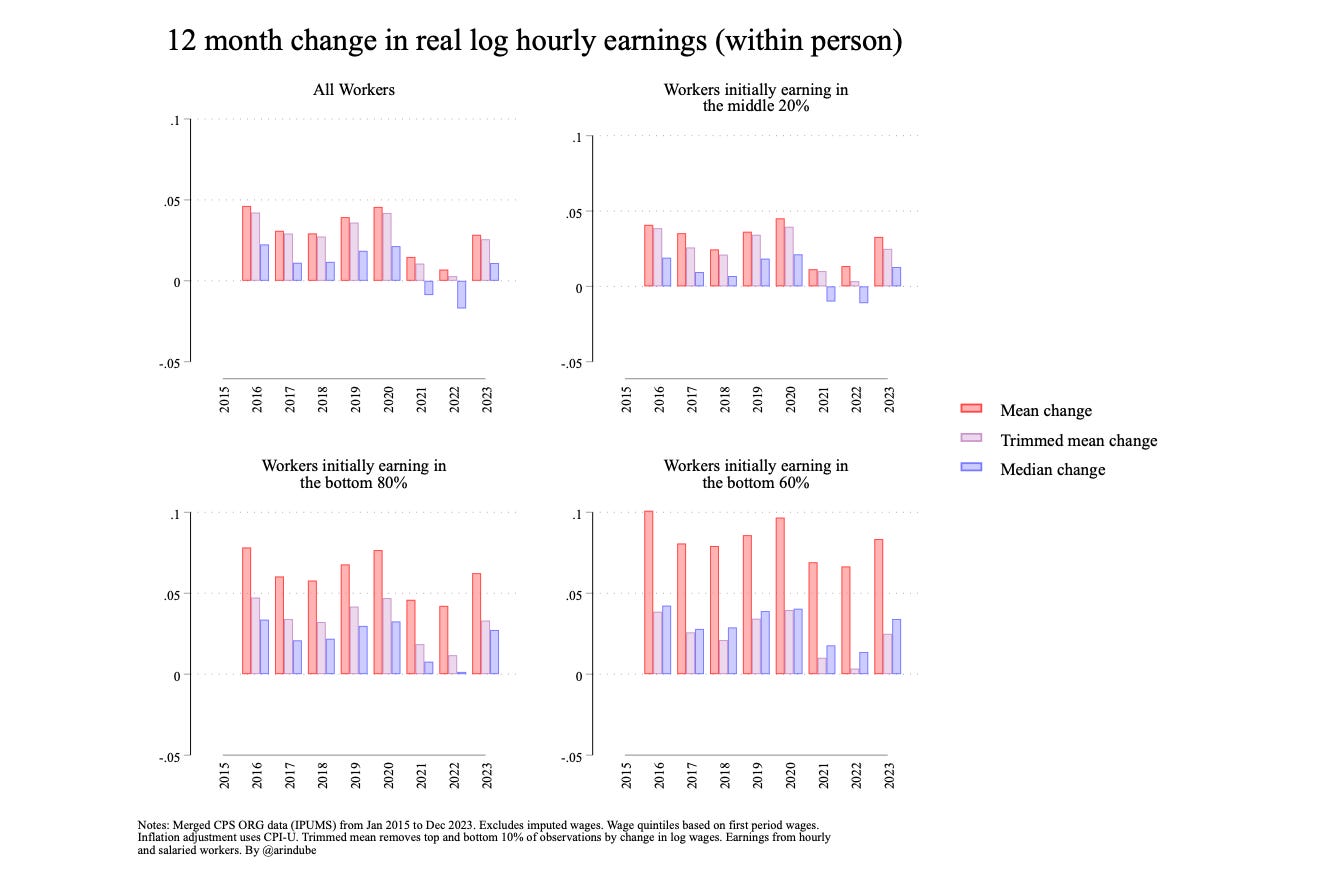
The figure below reports the mean, trimmed mean, and median 12 month changes in real wages by year, between 2016 and 2023.
Here are the key findings:
For all workers between 16-65, the median real wage growth turned negative during 2021-22 (between -1 and -2 percent). However, the magnitudes of wage reductions were substantially smaller than what would be suggested by looking at median or mean wage trends (consistent with composition effects). Moreover, median real wage growth rebounded substantially in 2023. Importantly, if we consider the trimmed or simple means, real wage growth was small but still positive even during 2021 and 2022. In other words, the size of the wage gains tended to be bigger than the size of wage losses.
If we focus on workers in the middle quintile (or middle 20 percent) of initial wages, we find wage growth to be more positive than the workforce overall. The reduction in real wage growth during 2021 and 2022 was smaller for these middle income earners than the workforce overall—whether we look at the mean, the trimmed mean, or the median. For this group, the mean change in real wage was 1.2 percent annually, while the median change was around -1.1 percent. But wage growth has strongly rebounded subsequently 2023 (to 3.3 percent for the mean and 1.3 percent for median).
If we consider the bottom 80 or 60 percent of earners based on initial wage, the picture looks rosier. In both cases, the mean, median and trimmed mean wage growth were all positive even in 2021-2022. In other words, the real wage reductions in 2021-2022 were disproportionately a high-wage worker phenomenon. For the bottom 60%, the median wage growth was 1.8 percent in 2021 and 1.4 percent in 2022. The magnitude of fall in wage growth was more modest for this group. Interestingly, for this group, mean wage growth in 2021-2022 was only modestly lower than pre-pandemic period—which likely reflected the sizable wage gains that accrued to job switchers at the bottom of the distribution.
Real wage growth during 2021-2022 was held back for many workers from the burst of inflation in 2021 and 2022, much of which was felt by workers across the world including in our peer countries. However, the tight labor market in America provided a degree of protection especially to lower-wage earners, who experienced relatively more positive real wage gains even during the difficult inflationary period. Happily, in 2023, as inflation subsided, we witnessed a strong return of real wage growth for most workers in the labor market.


